In Situ Labs logo
Get Started
Built for real work

Your data — clean, connected, accessible

ISLdata brings information gathering, procedure, live monitoring, and reporting under one system. Created and maintained by researchers who run field programs, manage laboratories, and publish their work — who use it every day.

Actively in development — contact us to explore trial or hosted access.
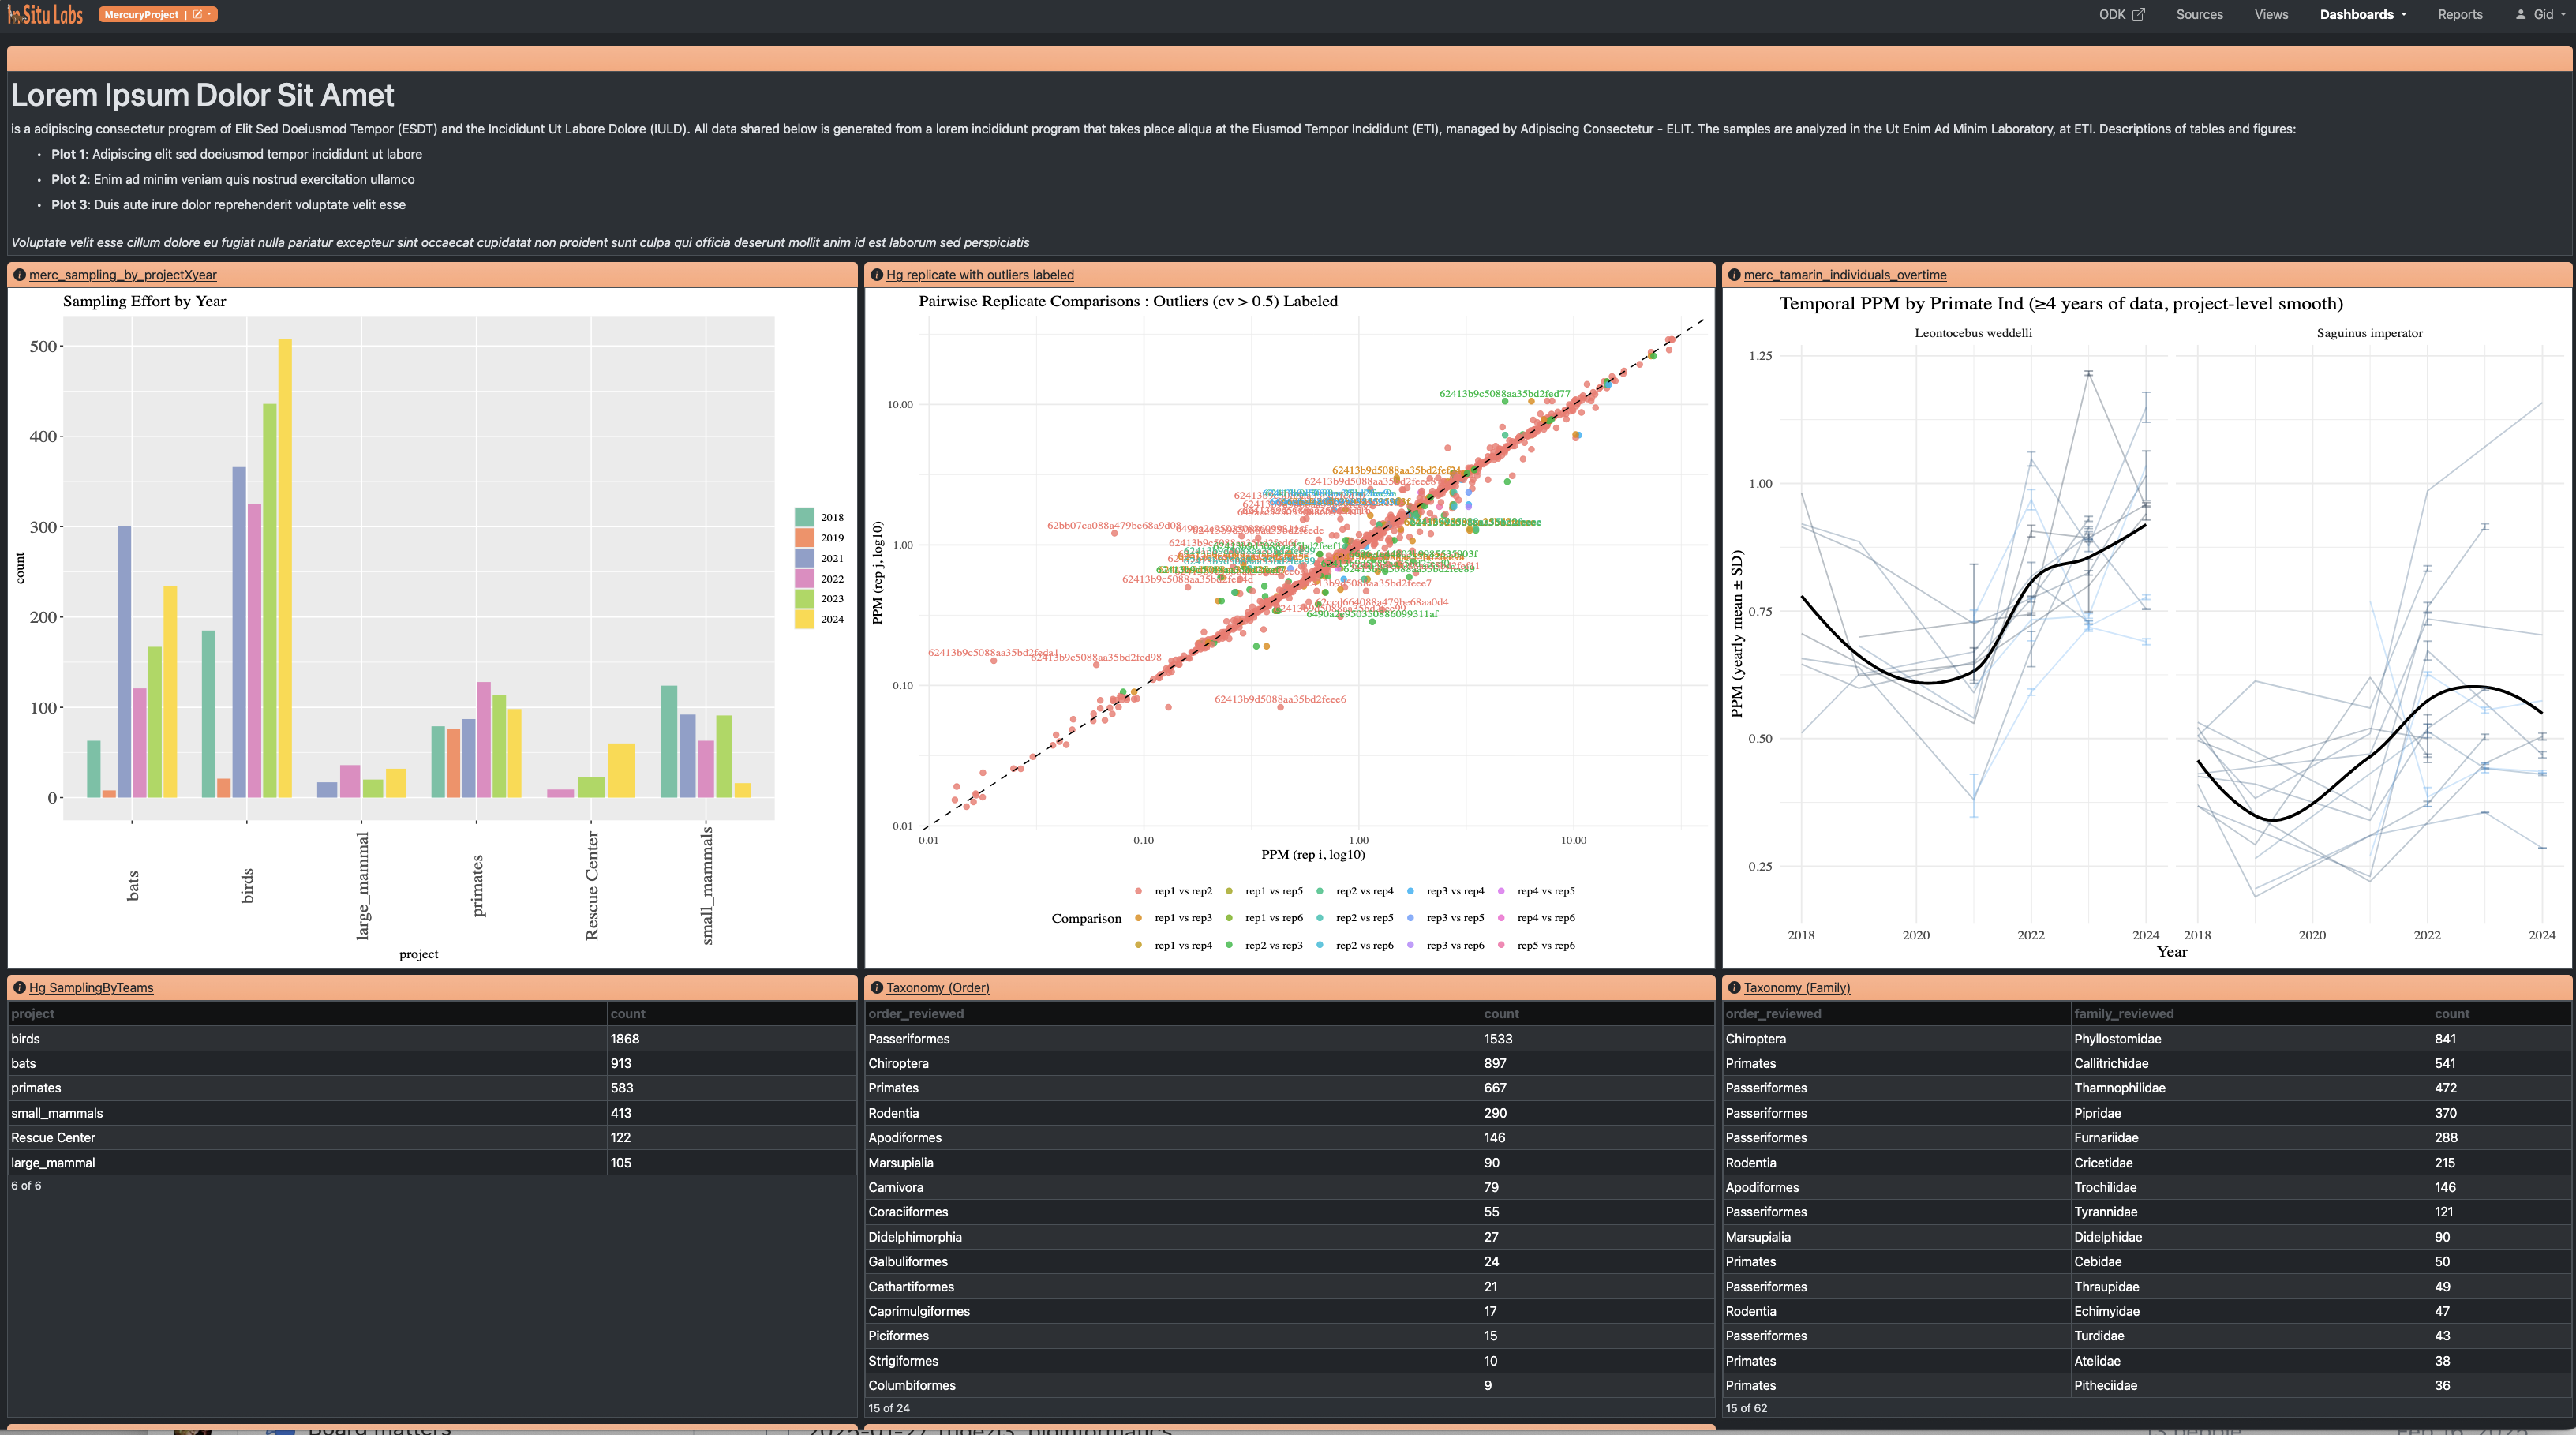
ISLdata dashboard with charts and analytics
Dashboard
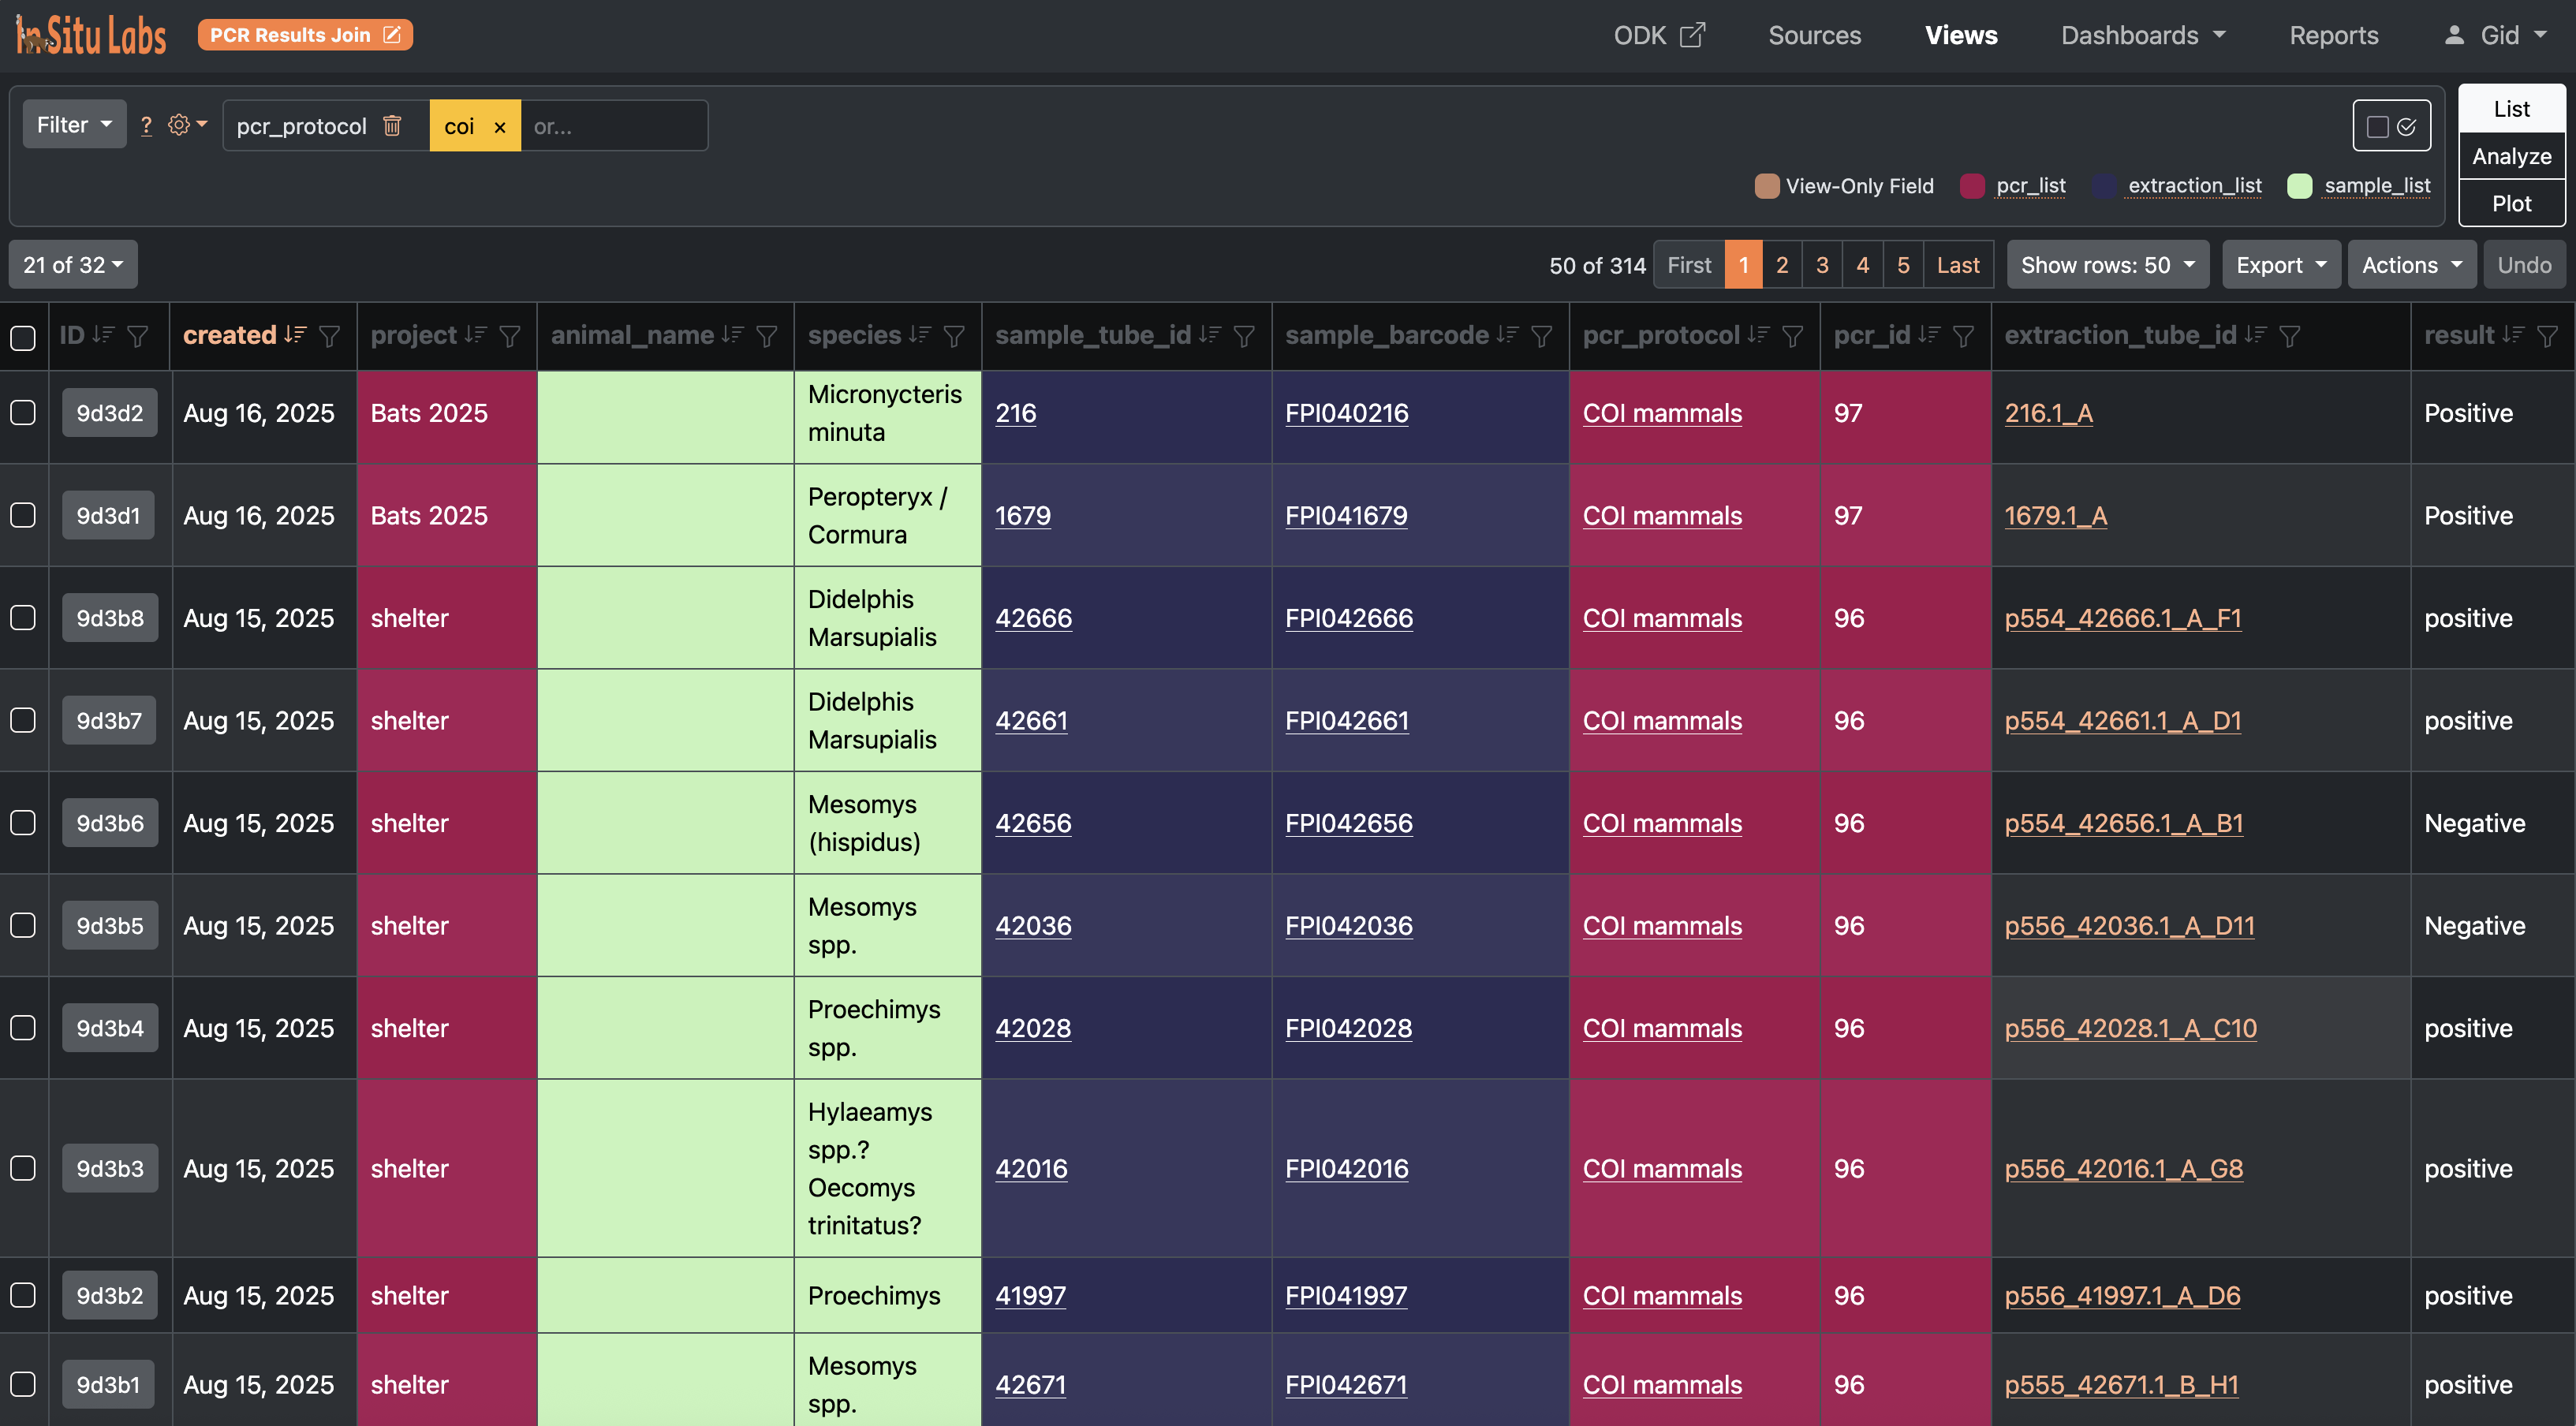
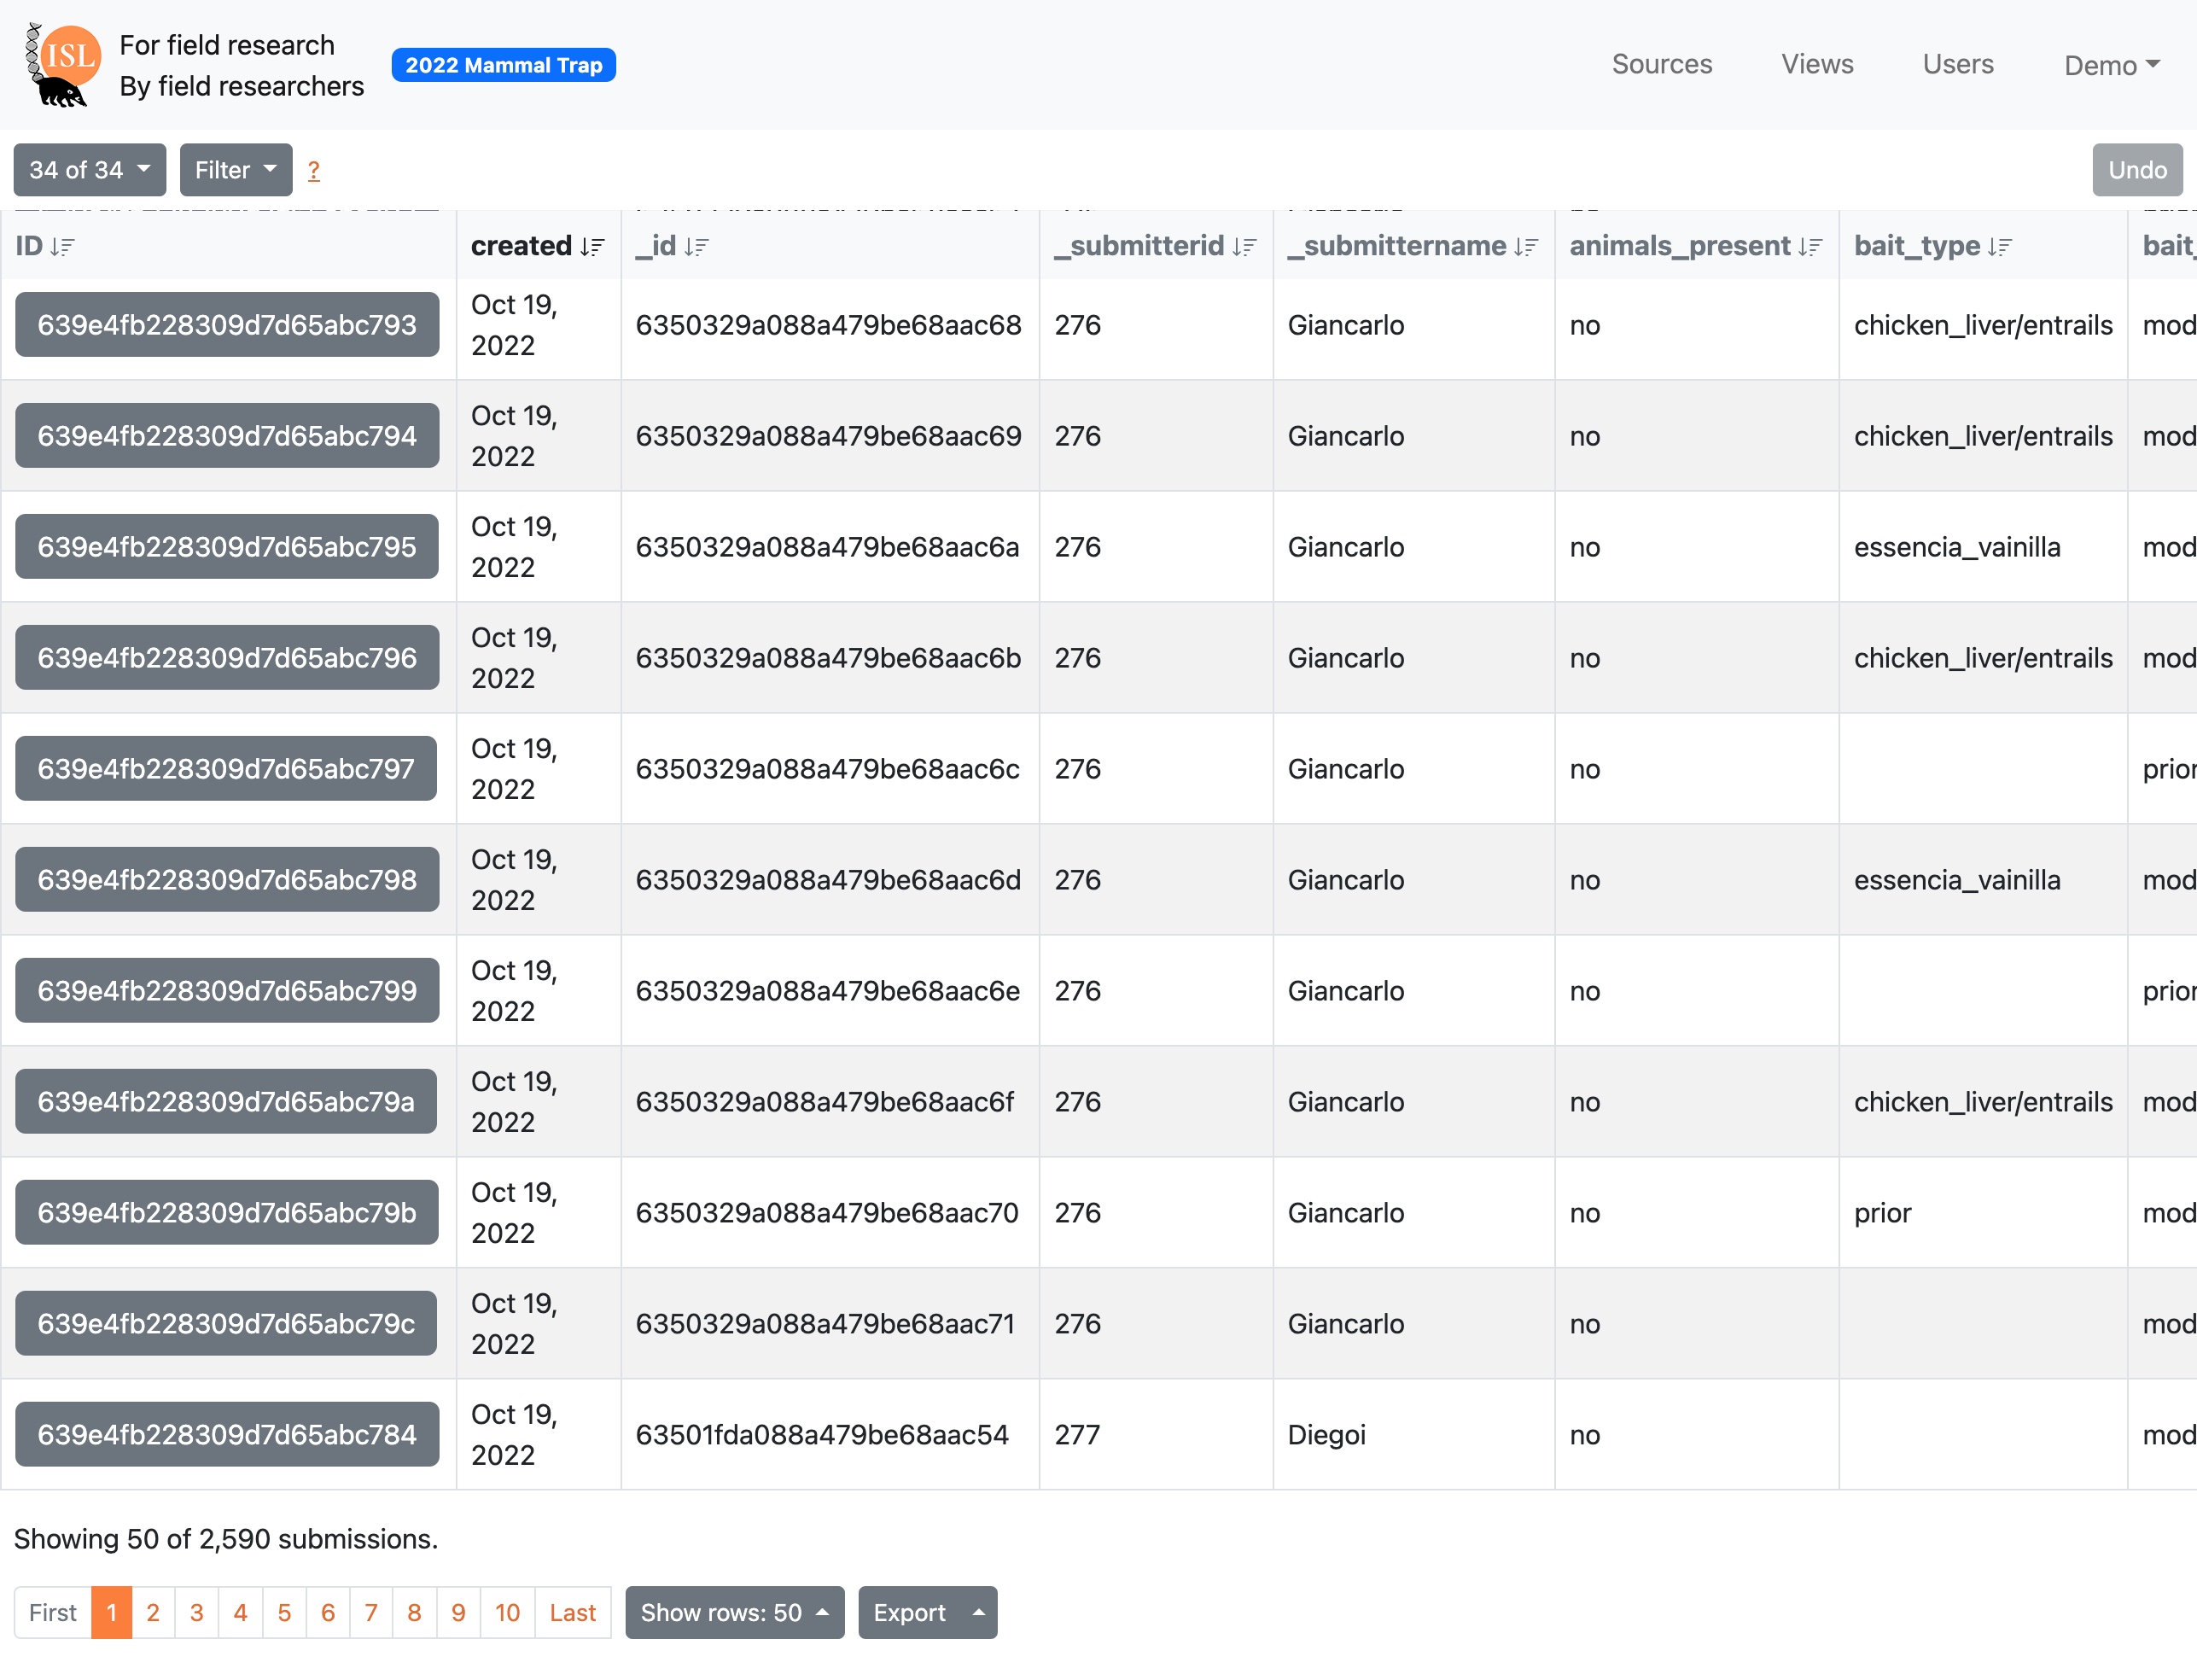
ISLdata data views with color-coded samples
Data Views
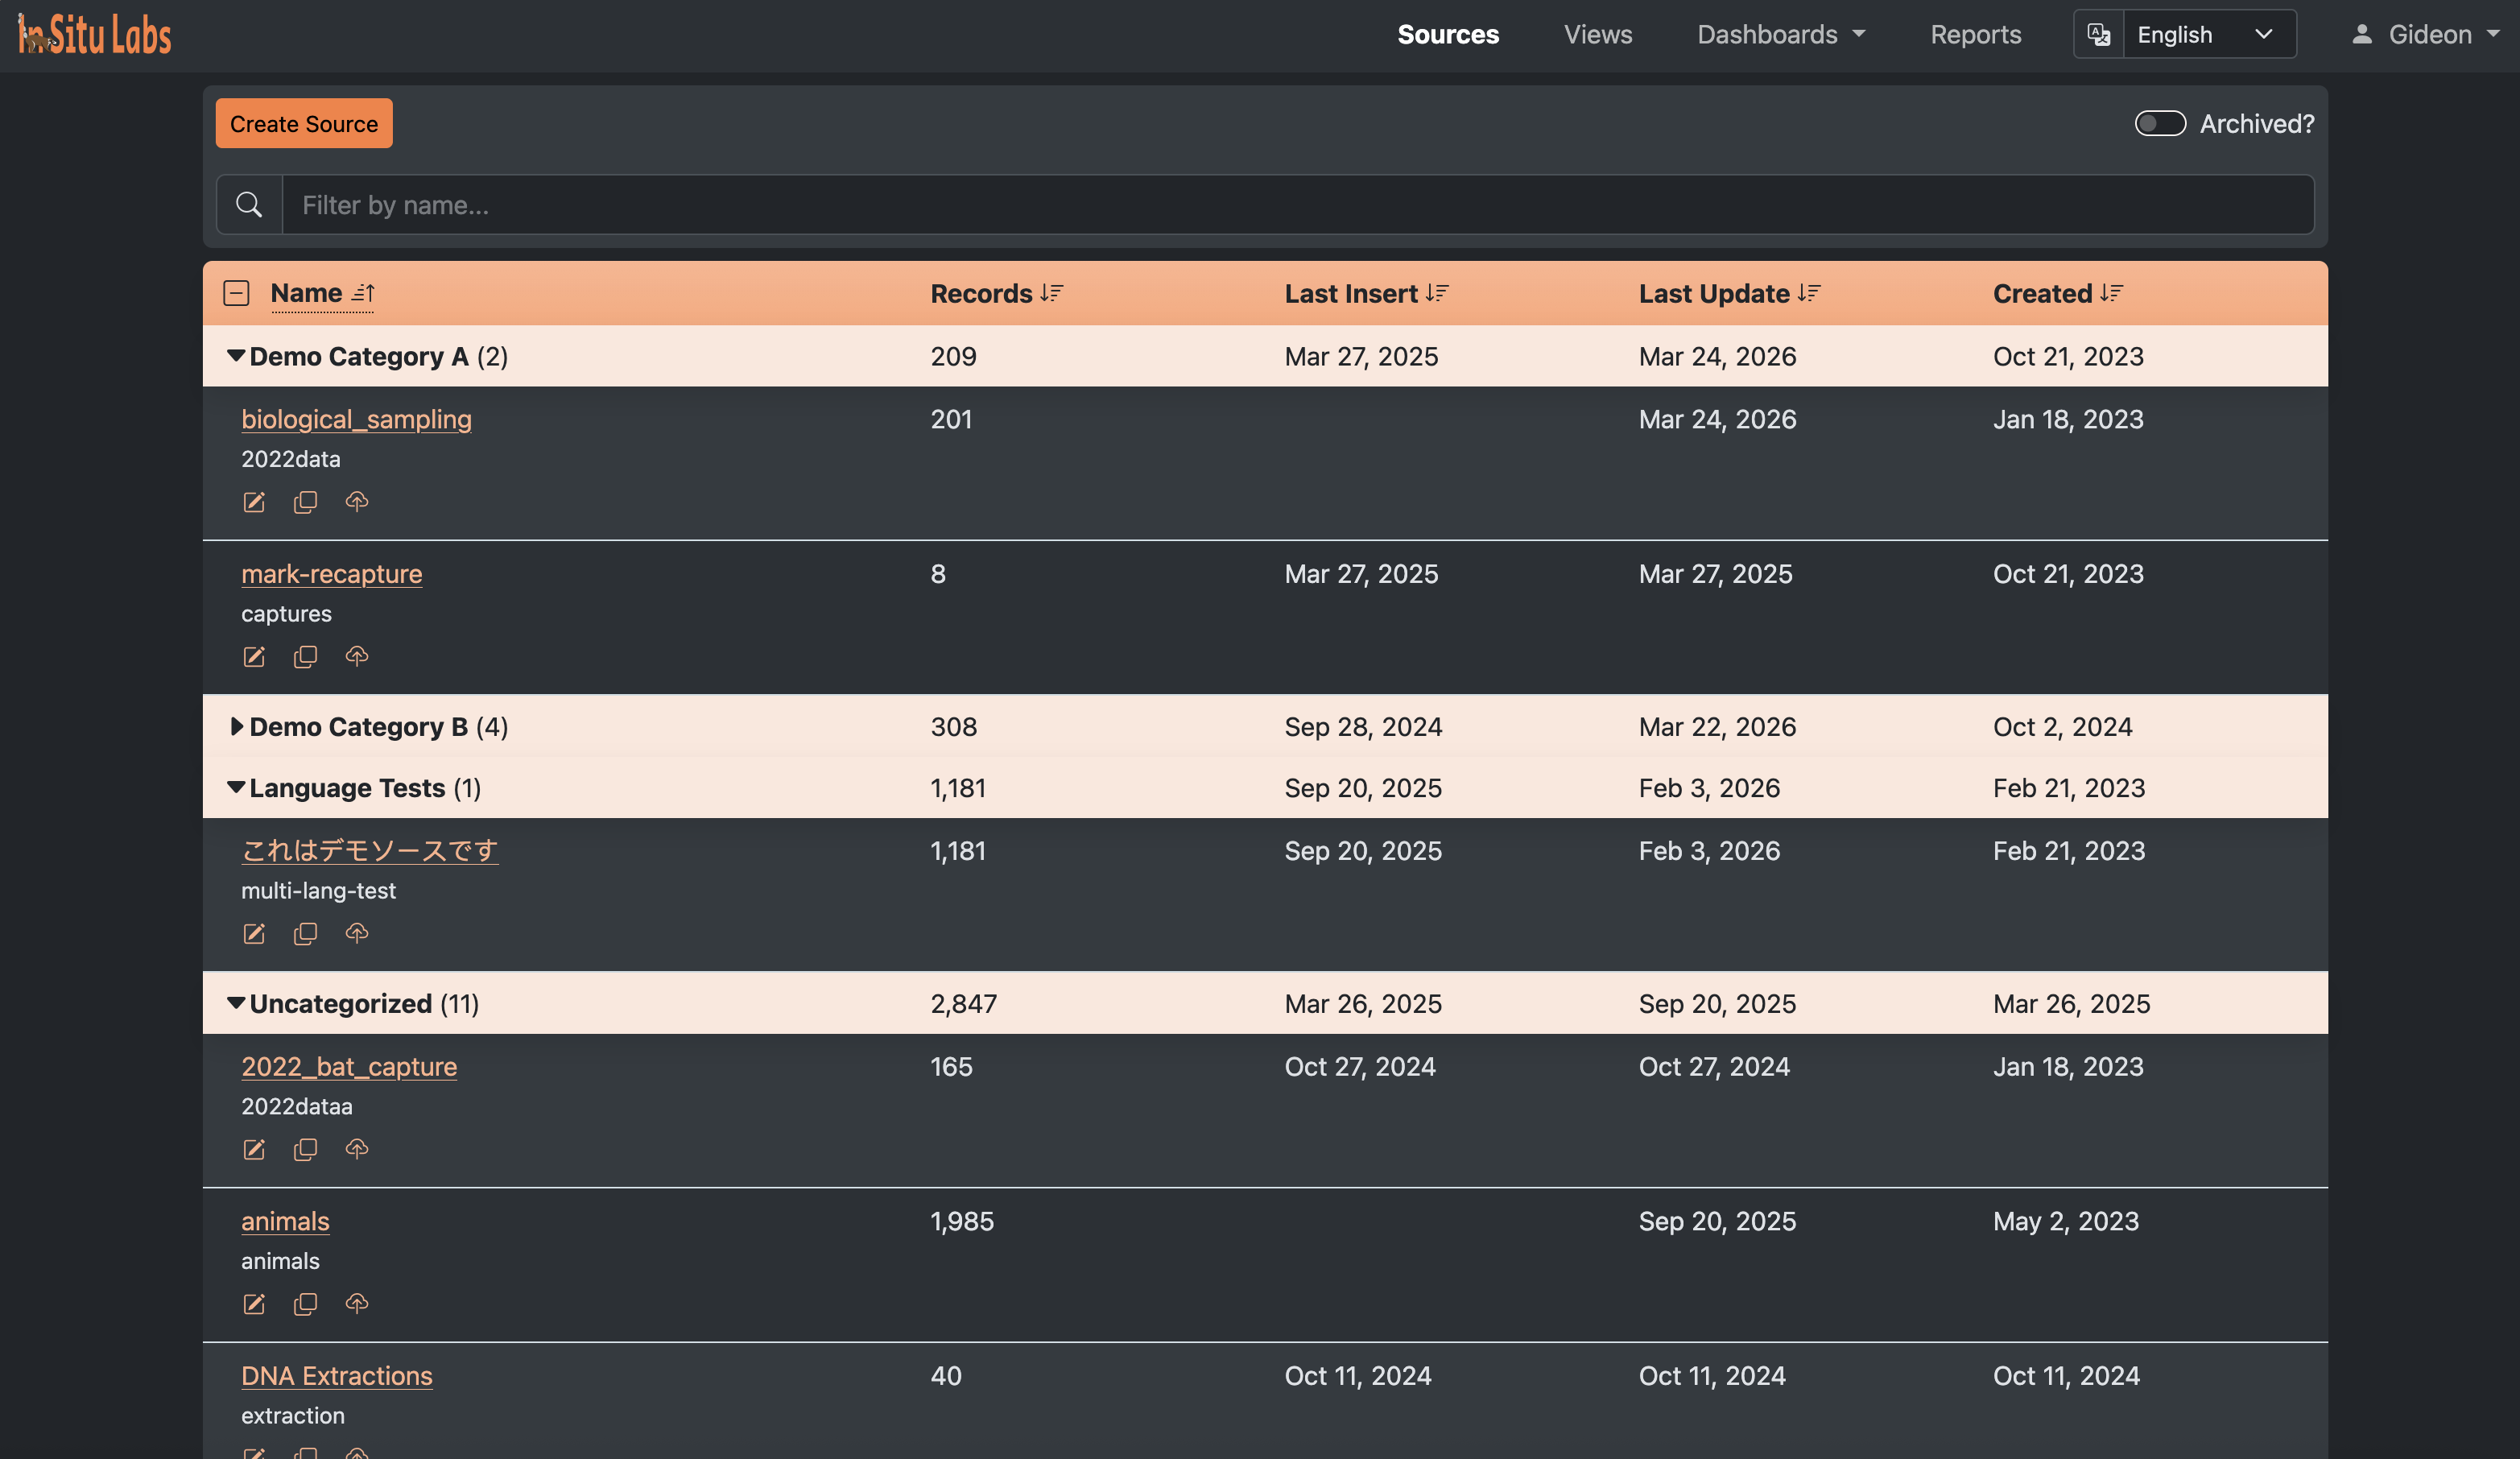
ISLdata sources management
Sources
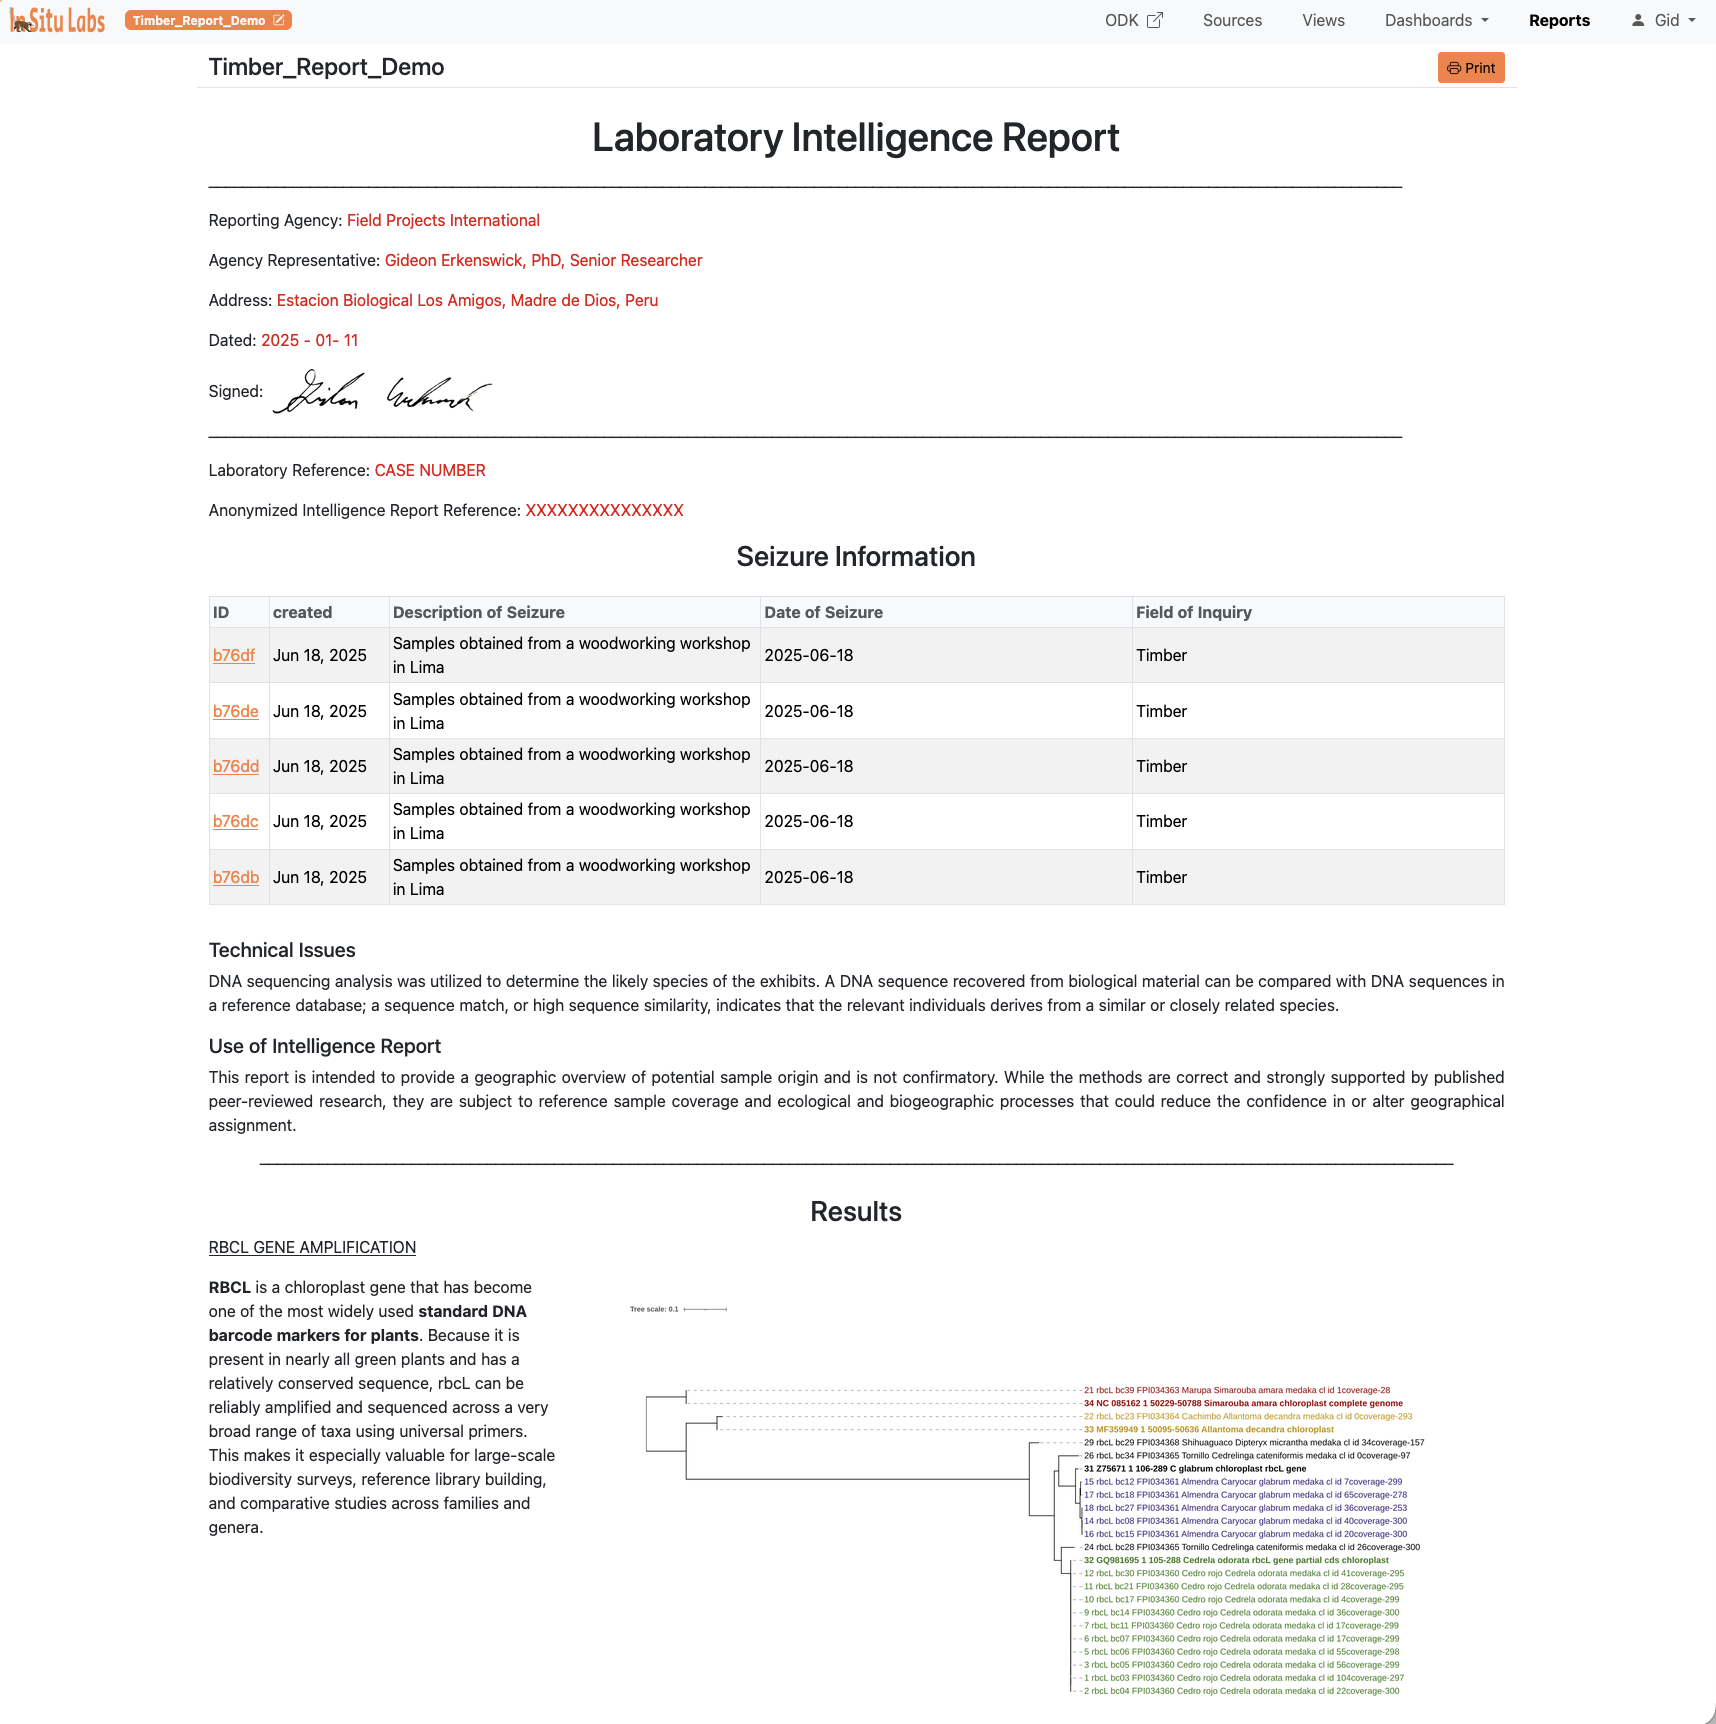
ISLdata laboratory intelligence report
Reports
Collect in the field Store & organize Process in the lab View & explore Report & publish

Built for biology. Ready for anything.

We built ISLdata for observational research, biological sampling, molecular lab analyses, and standardized reporting. But the underlying architecture translates naturally across disciplines.

ISLdata
Core Functions
Collect · Store · Process
View · Report
Biology &Conservation PublicHealth Commercial /Enterprise Agriculture &Veterinary Environ-mental SocialSciences
Biology & Conservation
CField Data Collection
SBiobanking & Samples
PLaboratory Analysis
VSpecies Dashboards
RConservation Reporting
← what we built it for
Public Health
CSurvey & Surveillance
SSample Tracking
PDiagnostic Analysis
VOutbreak Monitoring
RCompliance Reporting
pathogen screening, One Health
Commercial / Enterprise
CField Inspections
SInventory Management
PQuality Control
VOperations Dashboards
RCompliance Reporting
Agriculture & Veterinary
CHerd / Crop Records
SLab Samples & Inputs
PYield Analysis
VSeason Monitoring
RRegulatory Reporting
Environmental
CSensor Data & Transects
SLong-term Datasets
PSite Analysis
VTrend Monitoring
RImpact Reporting
Social Sciences
CSurvey Work
SParticipant Records
PQualitative Coding
VProgram Dashboards
REvaluation Reporting

The complete picture

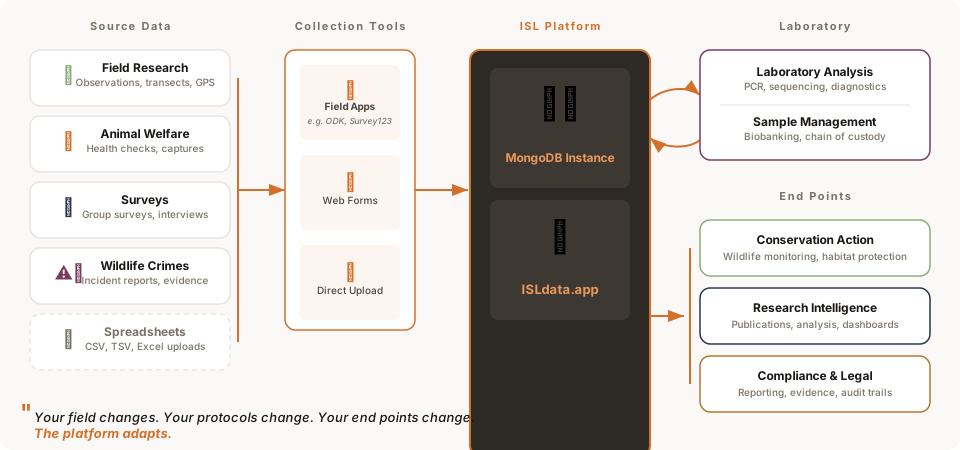
Source data flows through your integrated collection tools to the ISL platform for storage, processing, and laboratory integration, then out as standardized reports and dashboards — showing status, results, insights, compliance — for decision-making and action.

ISLdata system overview

What's inside

You don't need to be a database expert to use ISLdata. But understanding a few concepts will help you see why it's more powerful than a spreadsheet.

Select a capability below to see how it works

Data Sources

Where your data lives

Think of a Source as a single structured collection of related records — like a spreadsheet tab, but more powerful. Each connected form or survey — from ODK Central, ESRI Survey123, or Google Forms — becomes a Source. Each CSV, TSV, or Excel file you upload becomes a Source. Your raw data lives here exactly as collected, organized by project, year, or however you prefer.

Import from multiple collection platforms, upload CSV/TSV files, or connect live data streams directly. ISLdata prioritizes getting data in cleanly, then makes any needed cleanup efficient.

Global Search finds any Source, View, Dashboard, or Report by name, and any record by its ID — including the records that were copied from it further down your workflow.

Advanced Views

Seeing across your data

A View lets you combine data from multiple Sources into a single live table — without copying or duplicating anything. Join field observations and lab results by sample ID in a few clicks, not SQL. Views always reflect current data and update automatically as new records arrive.

Create cross-source merges, apply lookups, compute derived fields, filter and summarize. Enable materialized views for complex joins that need to run fast — ISLdata refreshes them automatically in the background.

Views are also working surfaces — you can add entirely new fields that don't exist in any source, letting your team build categorisations, flags, or derived values directly on top of the data without touching the original collection.

Dashboards & Reports

Your project at a glance

Any number of Dashboards and Reports can turn your Sources and Views into something you can share and act on — data plots, Source records, Views. Static content such as images and text (titles, legends, background info) can also be added to Dashboards and Reports to provide key context. Reports can be exported as PDF or HTML pages. These rich features always reflect the most up-to-date data in your system — make it once and use it over and over.

Build panels with lists, plots, rich text, and statistical outputs. Use the Analyze tool to quickly group data and show multiple stats — counts, means, standard deviations, etc. — in a single table. Use the R terminal in the Plot Source or Plot View feature to make rich and complex figures with R code for your dashboards and reports.

Integration

Connected from the start

Connect ODK Central, ESRI Survey123, and Google Forms. Each connected platform feeds directly into your Sources without manual export and re-import steps — new submissions, and their photos and file attachments, sync automatically every few minutes.

Setting up a connection is a simple request to our support team. For ODK Central and ESRI Survey123, we'll ask for your server address and valid credentials; for Google Forms, you share the form with an ISL service account email and send us the link. (File-upload questions in Google Forms are not currently supported.)

More integrations are in active development. If your collection tool isn't listed yet, reach out — we prioritize based on what our community needs.

Isolated Workspaces

Complete data isolation

Each organization runs in its own Workspace — a completely separate database with its own set of sources, views, dashboards, reports, and users.

Each workspace has independent auditing. New workspaces start from scratch or from a ready-made schema for inventory, clinical work, biobanking, or laboratory workflows. Self-host and create workspaces for all your departments.

Full Audit Trail

Every action, recorded

Every data access, import, export, and edit is logged automatically — no configuration needed. Revert changes when needed. Know exactly who did what, and when, across the entire history of your workspace.

Essential for compliance, reproducibility, and institutional trust.

Pipeline Tracking

Forward and backward through your workflow

As records move through a research pipeline — from field collection to lab processing to results — ISLdata maintains traceable links in both directions. From any record, you can follow it back to where it originated, or forward to what it became. No manual bookkeeping required.

Thoughtful by design

The little things that make it a pleasure to use

ISLdata's core is powerful — but it's the thoughtful details that make daily work feel smooth. These aren't headline features. They're the ones you'd miss the moment they were gone.

Scroll to explore
Actively in Development

Get access

ISLdata is under active development and we are happy to onboard interested parties. Whether you need a trial, a hosted workspace, or support for an independent deployment — get in touch and we'll find the right fit.

Individuals, Researchers & Educators
Trial & Hosted

Start with a trial; transition to a managed hosted workspace when you're ready


  • Free trial to explore the full platform
  • Trial transitions to a hosted workspace
  • Minimal hosting fees for managed instances
  • Views, dashboards, reports & integrations
Request a Trial

Not sure which fits? Get in touch — we're happy to talk through your situation and find the right path forward.

Why ISLdata

What makes ISLdata worth using

What makes ISLdata worth choosing — and honest answers to the questions teams ask before committing.

Why teams choose ISLdata

Most teams cobble together a collection tool, a spreadsheet for tracking, a separate database, and yet another tool for reporting. ISLdata replaces that patchwork with one integrated system — from data collection, through analysis workflows, to reporting.
As soon as data lands in the system (digital or manual), your views and dashboards are updated. No waiting for someone to download, clean, and summarize.
ISLdata isn't built by a software company guessing at your workflow. It's built by researchers, laboratory technicians, supply managers, and supervisors who run programs, manage labs, publish papers, and sell services — and who use ISLdata every day.
This system was built and is maintained by its user community. With more members we can reduce the cost even lower. If you are interested in this system but cannot afford the standard hosting fee, please get in touch.

Common questions

ISLdata is a data management platform that integrates field collection, sample tracking, laboratory analyses, and reporting under one system. It connects to collection tools like ODK Central, ESRI Survey123, and Google Forms, and provides powerful views, dashboards, and a full audit trail. Built and maintained by Field Projects International as part of the In Situ Laboratory initiative.
However works best for your team. Connect a collection platform — ODK Central, ESRI Survey123, or Google Forms — and new submissions sync in automatically; upload CSV, TSV, or Excel files; or enter records directly in ISLdata. Most projects mix several methods, and ISLdata is designed to bring them together rather than lock you into one. To connect a platform, just contact our support team and we'll set it up with you.
Absolutely. ISLdata runs on Docker Compose and can be deployed on any server with Node.js and MongoDB. Many teams self-host on DigitalOcean, AWS, or on-premises infrastructure. If you'd rather not manage hosting yourself, we offer managed hosting through FPI.
Each organization's data lives in its own isolated database — never mixed with other teams. All access, edits, imports, and exports are logged in a full audit trail. Authentication uses secure passwordless magic-link email. For hosted instances, FPI manages SSL, backups, and security updates. Read our full data security statement.
Hosted workspaces for researchers and educators are USD 40/month, and you can start with a free trial to explore the full platform. Self-hosting requires a one-time software license — get in touch and we'll find the right fit.

Documentation

Browse the documentation below, or get in touch and we'll help you get started.

Getting Started

Set up your first workspace, connect your collection tools, and import your first data source.

User Guide

Learn how to create sources, build views, design dashboards, and generate reports for your data.

Coming soon

Admin & Hosting

Self-host with Docker Compose, configure environment variables, manage workspaces, and set up backups.

What's coming

Built by researchers, shaped by use

ISLdata grows alongside the programs that depend on it. Here's what we're working on and thinking about next.

In development

Data-assisted review

Automatic flagging of anomalies, duplicate entries, and outliers as data arrives — so your team catches issues before they reach analysis.

In development

Public read-only objects

Publish sources, views, dashboards, and reports as public read-only links — no login required. Ideal for community reporting, open datasets, and funder transparency.

Planned

Mobile companion app

Capture field observations, scan sample IDs, and sync data offline. Designed for the conditions field teams actually work in.

Planned

Cross-workspace collaboration

Share selected views or datasets across partner organizations while keeping your workspace isolated. Built for multi-site consortia.

Have a feature in mind? We'd genuinely like to hear it.   Drop us a note →

Ready to connect your data?

Whether you're an individual researcher, a university lab, or a conservation organization — we'd love to help you get started with ISLdata.